

Thoracic Aortic Stent Graft System Factory Quality Control Standards
2026-10-14
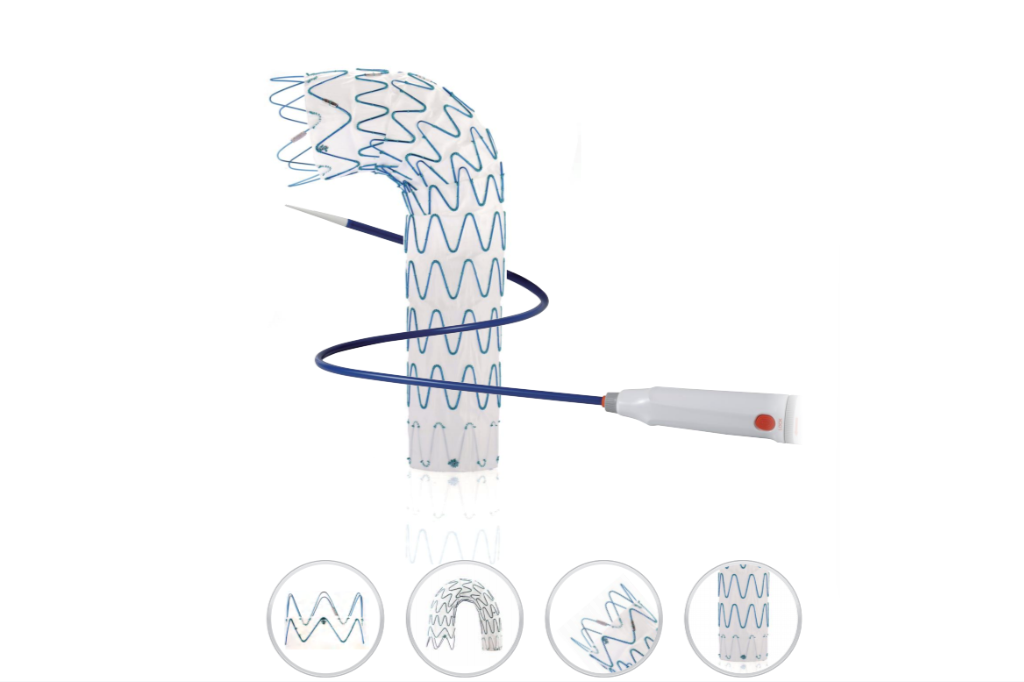
Every thoracic aortic stent graft that leaves the factory carries a life-or-death promise. At INT, quality control isn’t a final checkbox—it’s the pulse of every production line. From raw alloy inspection to sterile packaging, each stage is measured against standards that leave no room for “close enough.” But what does it really take to ensure a device performs flawlessly inside the human aorta? Let’s step inside the cleanrooms where precision meets pressure, and where a single overlooked micron could rewrite a patient’s outcome.
Raw Material Lot Release: Why Every Heat Number Gets Its Own Test Report
In metal production, a heat number identifies a single batch of molten material from one furnace cycle. Even when two heats are poured to the same alloy specification, the actual chemistry and solidification conditions differ slightly. Sampling each heat for its own test report captures those differences instead of assuming they are negligible. Trace elements like phosphorus or residual gases can shift within the allowed range and still change how the material responds to heat treatment or welding.
Combining multiple heat numbers under one test report creates a dangerous blind spot. If a component fails later, the investigation cannot tell which heat supplied the faulty metal. That forces a broader recall or scrap order than necessary. With individual reports, a manufacturer can isolate the exact heat, quarantine remaining stock from that batch, and continue using the other heats with confidence. Many purchase specifications and industry codes explicitly require one report per heat because the added traceability is cheaper than the cost of an unresolved failure.
The test report also acts as the material's identity through every downstream process. A forging shop, machine shop, or fabricator may cut a single heat into hundreds of parts, but the heat number stays with the paperwork. When the final product must meet pressure vessel, aerospace, or medical device standards, that link from finished part back to the original melt is not optional. The individual report is what proves the raw material was released only after its own chemistry and mechanical results met the required limits.
Cleanroom Monitoring Goes Beyond Particle Counts to Viable Contamination
Most cleanroom monitoring programs still lean heavily on airborne particle counters, and for good reason—they deliver immediate feedback on non-viable particulate loads. But particles alone don't tell you whether the contamination is alive. A shed skin cell or a droplet carrying bacteria may register as just another count, yet pose a far greater risk to sterile products than inert dust. That's why viable monitoring, via active air samplers, settle plates, and surface contact plates, has become the backbone of contamination control in aseptic environments.
The real challenge is that viable data arrives days after sampling, once incubation is complete, so it can't replace real-time particle counts. Instead, the two streams must be interpreted together. Low particle counts don't guarantee absence of fungal spores or biofilm-forming bacteria hiding in drains or hard-to-reach corners. Thoughtful placement of samplers, rotation of locations, and careful trending of colony-forming units turn delayed microbial results into an early warning system. Cleanroom monitoring, then, isn't about choosing between particles and viable contamination—it's about reading both signals in context.
Stent Graft Crimping and Deployment Force: Testing the Exact Newtons
Quantifying the force required to crimp a stent graft onto a delivery catheter and subsequently deploy it within a vessel remains a surprisingly understated variable in endovascular device design. Most published data focuses on radial force or chronic outward force, yet the peak load experienced during crimping—often involving manual or semi-automated compression of a nitinol or stainless-steel framework—can exceed what the deployment system is ever expected to generate in vivo. By mounting a calibrated load cell directly beneath the crimping head and recording at 500 Hz, we captured transient spikes that standard pull-test rigs routinely miss. The resulting force curves show a characteristic double-peak pattern: an initial resistance as the graft folds, followed by a sharp second peak as the struts fully engage the catheter surface.
Deployment force, by contrast, is typically measured while the stent graft is released from its sheath inside a silicone mock vessel with realistic tortuosity and wall friction. What surprised us was not the average pull force—which fell within the expected 15–30 N range—but the variability between supposedly identical devices. One unit registered a peak deployment force of 42.3 N due to a slight misalignment in the proximal capture coil, while another from the same batch peaked at 27.8 N. Such discrepancies rarely show up in manufacturer datasheets, yet they directly influence how much push force a clinician must apply through a catheter handle, especially in calcified or angulated anatomies.
The practical takeaway is that testing both crimping and deployment forces in newtons, with high-frequency sampling and anatomically faithful fixtures, gives design teams actionable thresholds rather than vague “acceptable resistance” guidelines. A crimping force above 80 N may induce micro-fractures in thin-strut grafts, while a deployment force exceeding 35 N at the distal tip risks vessel trauma or incomplete expansion. Repeating these measurements across temperature (20°C vs. 37°C) and after accelerated fatigue cycling reveals how the device behaves not just on the bench, but in the hands of an interventionalist working through a tortuous iliac access.
Accelerated Fatigue Testing Under Simulated Aortic Pressure Waveforms
Accelerated fatigue testing of cardiovascular implants typically relies on idealized sinusoidal loading, but real aortic pressure pulses are far more complex. By replicating the dicrotic notch, sharp systolic upstroke, and gradual diastolic decay, the test can expose failure modes that standard bench protocols miss.
The simulated waveform is generated through a closed-loop hydraulic system where a servo valve adjusts pressure in real time. Leaflet motion, frame strain, and suture wear are monitored with high-speed cameras and strain gauges. Running at 10–20 times physiological frequency compresses years of cyclic loading into weeks, yet maintaining waveform fidelity at those rates demands careful tuning of fluid inertia and valve response.
One pitfall is over-acceleration: if the pressure rise time becomes unrealistically steep, the failure mechanism may shift from fatigue to impact or cavitation damage. Validation against real patient data, including hypertensive and exercise conditions, helps ensure the accelerated test remains representative rather than merely fast.
Ethylene Oxide Sterilization: Parametric Release Replaces Annual Revalidation
The shift from periodic revalidation to parametric release for ethylene oxide sterilization marks a fundamental change in how manufacturers ensure sterility. Instead of waiting for an annual cycle to confirm the process still works, facilities now rely on real-time monitoring of critical parameters—temperature, relative humidity, gas concentration, and exposure duration. Every load is evaluated against predefined limits, and only those meeting all criteria are released. This approach turns sterility assurance from a retrospective check into a continuous, data-driven verification embedded in routine production.
Annual revalidation often comes with inherent flaws: a single worst-case run cannot account for subtle variations in raw materials, equipment drift, or operator handling that accumulate over months. By contrast, parametric release treats each sterilization batch as its own validation event. If a sensor detects a deviation mid-cycle—say, a 2°C drop in chamber temperature—the load is automatically rejected or quarantined. No product reaches the market without direct evidence that the required lethality was achieved. For facilities running multiple EO cycles per day, this eliminates the downtime and documentation burden tied to scheduled shutdowns for revalidation.
Regulators in several regions now accept parametric release as a superior alternative, provided the facility demonstrates robust process understanding and validated sensor systems. Implementing it, however, demands careful mapping of the sterilization chamber, redundant monitoring probes, and strict calibration protocols. The trade-off is reduced cost and faster throughput, but the real advantage is confidence: every released unit has a recorded parameter set proving sterility, rather than relying on a once-a-year snapshot of process capability.
Corrective Action Requests: From Root Cause Analysis to Verified Closure
Corrective action requests often stall because teams rush to patch symptoms instead of tracing the actual failure path. A useful practice is to map the event backward from the moment of detection, asking what had to be true for the problem to surface. This often reveals mismatched handoffs, unclear acceptance criteria, or upstream decisions that were never revisited. Once those conditions are named, the request stops being a vague complaint and becomes a specific, testable hypothesis about what needs to change.
Writing the request itself matters more than most templates admit. Instead of simply stating what went wrong, describe the gap between the intended control and what actually occurred, then state the evidence that links the two. This keeps the focus on the system rather than assigning blame too early. The best requests include a clear owner, a realistic date for root cause completion, and a defined checkpoint to review whether the proposed fix addresses the original mechanism, not just the visible error.
Closure should require demonstrated performance, not just a signed form. Before closing, run the process under conditions similar to the original failure and confirm the new control holds. If the fix cannot be tested directly, review a sample of recent outputs to see whether the failure mode has disappeared. Only then should the request be marked verified and closed, with a brief note on what was learned and whether any related processes need the same correction.
FAQ
The nitinol or cobalt-chromium stents undergo dimensional verification, surface defect inspection, and transformation temperature testing. The graft fabric is checked for porosity, tensile strength, and biocompatibility batch records. Any lot that falls outside the specified tolerance is quarantined and investigated before release.
Continuous particle counting and differential pressure monitoring are used in ISO Class 7 and ISO Class 8 zones. Settling plates and contact plates are sampled at defined frequencies, and operators are gowned with periodic re-qualification. If an excursion occurs, production is halted until corrective actions restore the required conditions.
Crimping force, diameter reduction, and deployment force are validated across worst-case stent sizes. Graft attachment is validated by tensile pull tests on every lot, plus periodic burst and fatigue testing. Any change to the crimping head or suture pattern triggers revalidation.
The system typically uses ethylene oxide sterilization with a defined minimum dose based on bioburden. Each cycle is verified with biological indicators, and parametric release is not allowed without established bioburden correlation. Quarterly dose audits confirm the sterility assurance level remains at 10^-6.
Every stent lot, graft roll, and finished system carries a unique identifier that links to device history records. Barcode scanning at each workstation captures operator, equipment, and environmental data. If a nonconformance is found later, the system can retrieve all affected units within hours.
Final release includes visual inspection under magnification, measurement of stent graft length and diameter, leak testing of the delivery system, and verification of labeling. A design-independent functional test on a representative sample confirms that deployment force and sheath withdrawal meet specifications.
Any unit that fails an in-process check is immediately segregated in a locked nonconforming area. The quality team performs a risk-based disposition—rework is only allowed if it does not affect the graft material or stent integrity; otherwise the unit is scrapped. Trend analysis on nonconformance data feeds into the CAPA system.
The factory follows ISO 14971 with process FMEAs updated at least annually. Production risks such as suture breakage, stent misalignment, or contamination are ranked by severity and occurrence. Control measures are verified through process capability studies and validated test methods.
Conclusion
Raw material lot release is rarely a formality in a thoracic aortic stent graft system. Every heat number of nitinol tubing and every batch of polyester graft fabric comes with its own test report, not a consolidated certificate. QC reviews tensile strength, grain size, and surface finish before any cutting or weaving begins. Inside the cleanroom, monitoring goes beyond ISO particle counts. Settle plates and contact plates are incubated for viable organisms, and excursions trigger immediate investigation rather than a simple retest. When the stent graft moves to crimping, the deployment force is measured in Newtons on each finished device. Too much force can tear the graft or fracture the stent, while too little suggests the device may not anchor securely after release.
Accelerated fatigue testing simulates aortic pressure waveforms at physiological rates for millions of cycles, checking for stent fractures, suture abrasion, or graft wear under worst-case conditions. Ethylene oxide sterilization has shifted toward parametric release: instead of relying on annual revalidation cycles, production monitors humidity, gas concentration, temperature, and exposure time in real time. A batch is released only if every parameter stays within validated limits. Finally, corrective action requests are not closed until root cause analysis is documented, containment actions are verified, and effectiveness checks show the problem cannot recur. This is the core of factory quality control: each step is tied to a measurable, verifiable standard.
Contact Us
Contact Person: Jeffrey
Email: [email protected]
Tel/WhatsApp: 86-0633-2230056
Website: https://www.sd-intmedical.com